
 16.5K GitHub Stars
Monitoring Presto at Petabyte Scale – The Complete Guide to Observability, Prometheus, Grafana & Alerting
TL;DR
This tutorial is an enterprise-grade, step-by-step guide to building an end-to-end Presto Observability and Alerting Pipeline. You will learn how to extract Java Management Extensions (JMX) telemetry using the Prometheus JMX Java Agent, scrape cluster-wide metrics with Prometheus, visualize distributed workloads on a pre-built 24-panel Grafana dashboard, route critical incidents to Slack via Alertmanager, and execute SQL queries directly over Prometheus time-series data.
Key Concepts: Why Presto Monitoring is Essential
Presto (distributed SQL query engine for big data) operates as a distributed system composed of a single Coordinator and multiple Worker nodes. It processes multi-terabyte queries across diverse storage backends (Hive, Apache Iceberg, Delta Lake, MySQL, PostgreSQL, S3/GCS/HDFS) by breaking queries into stages, tasks, and streaming splits.
                    +---------------------------------------------+
                    |             Presto Coordinator              |
                    |  - Query Parser, Analyzer & Planner         |
                    |  - Resource Group Scheduler                 |
                    |  - Discovery Service                        |
                    +---------------------------------------------+
                                   /               \
                                  /                 \
                                 v                   v
                +--------------------+     +--------------------+
                |  Presto Worker 1   |     |  Presto Worker 2   |
                |  - Task Execution  |     |  - Task Execution  |
                |  - Split Processing|     |  - Split Processing|
                |  - Disk Spilling   |     |  - Disk Spilling   |
                +--------------------+     +--------------------+
The Three Observability Pillars in Presto
- JVM Runtime Health: Tracking Heap memory consumption, Garbage Collection (G1GC) stop-the-world pause durations, off-heap buffers, and thread pool exhaustion.
- Distributed Query Performance: Monitoring query state lifecycles (
QUEUED➡️PLANNING➡️STARTING➡️RUNNING➡️FINISHING➡️FINISHED/FAILED), split scheduling latencies, and cross-worker network data exchanges. - Multi-Tenant Concurrency & Memory Pools: Tracking resource group queues, per-user memory quotas, and intermediate disk spilling rates.
End-to-End Architecture & Telemetry Data Flow
Presto exposes its runtime telemetry through Java Management Extensions (JMX) MBeans. Because Prometheus requires a pull-based HTTP text endpoint, we embed the Prometheus JMX Java Agent inside each Presto JVM.
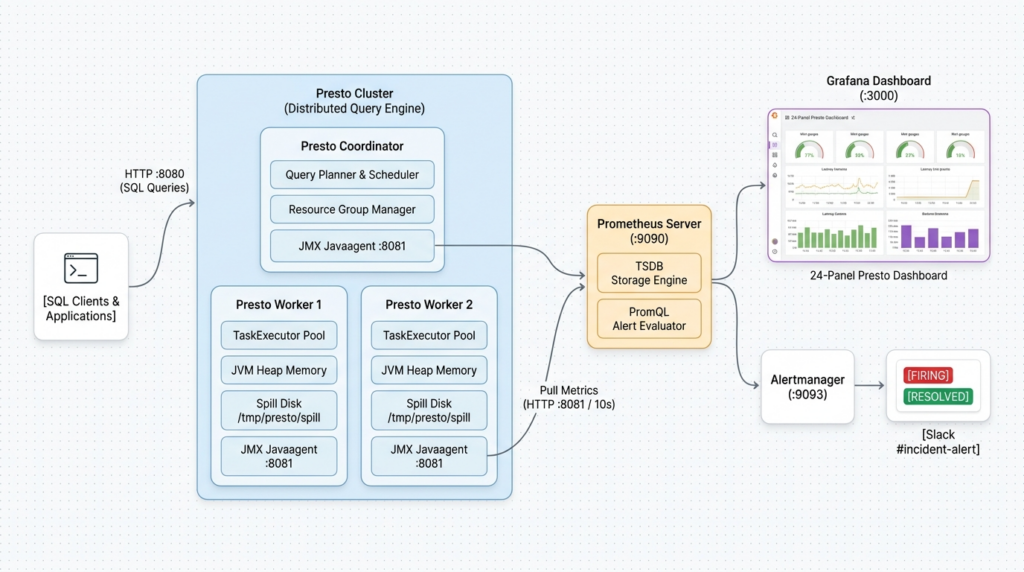
Component Port & Role Map
| Component | Port | Network Scope | Operational Role |
|---|---|---|---|
| Presto Coordinator | 8080 | Host & Bridge | Presto Web UI, Query Submission endpoint, Discovery service, Resource Group scheduler. |
| JMX Exporter (Coordinator) | 8081 | Host & Bridge | HTTP endpoint exposing Coordinator JVM & Presto query execution metrics. |
| Presto Workers (1 & 2) | 8080, 8081 | Internal Bridge | Split execution, task processing, memory pool management, disk spilling. |
| Prometheus Server | 9090 | Host & Bridge | Scrapes JMX endpoints every 10s, stores time series, evaluates alert rules every 5s. |
| Alertmanager | 9093 | Host & Bridge | Groups and deduplicates alerts, routes formatted Slack notifications. |
| Grafana | 3000 | Host & Bridge | Pre-provisioned 24-panel dashboard for real-time visualization. |
Repository Structure
The entire pipeline is containerized with Docker Compose. Below is the file structure:
presto-observability-pipeline/
├── docker-compose.yml                      # 6-container orchestration & network definition
├── bin/
│   └── jmx_prometheus_javaagent.jar        # Prometheus JMX Java agent binary
├── config/
│   ├── presto-shared/
│   │   └── presto-jmx-exporter.yaml        # Regex translation rules from JMX MBeans to Prometheus
│   ├── presto-coordinator/
│   │   └── etc/
│   │       ├── jvm.config                  # Coordinator JVM flags & -javaagent hook
│   │       ├── config.properties           # Coordinator engine & memory configuration
│   │       ├── resource-groups.properties  # Resource group configuration manager pointer
│   │       ├── resource-groups.json        # Multi-tenant resource group hierarchy & quotas
│   │       └── catalog/
│   │           └── prometheus.properties   # Presto connector to query Prometheus via SQL
│   ├── presto-worker-1/
│   │   └── etc/
│   │       ├── jvm.config                  # Worker 1 JVM flags & -javaagent hook
│   │       ├── config.properties           # Worker 1 engine, memory limits & spill paths
│   │       └── catalog/
│   │           └── prometheus.properties   # Worker 1 Prometheus connector catalog
│   ├── presto-worker-2/
│   │   └── etc/
│   │       ├── jvm.config                  # Worker 2 JVM flags & -javaagent hook
│   │       ├── config.properties           # Worker 2 engine, memory limits & spill paths
│   │       └── catalog/
│   │           └── prometheus.properties   # Worker 2 Prometheus connector catalog
│   ├── prometheus/
│   │   ├── prometheus.yml                  # Scrape jobs, intervals, and Alertmanager config
│   │   └── alert.rules.yml                 # 10 production alerting rules across P1, P2, and P3
│   ├── alertmanager/
│   │   └── alertmanager.yml                # Slack webhook routing and color-coded alert templates
│   └── grafana/
│       ├── provisioning/
│       │   ├── datasources/
│       │   │   └── prometheus.yaml         # Auto-registers Prometheus as default datasource
│       │   └── dashboards/
│       │       └── presto.yaml             # Auto-imports dashboard JSON on boot
│       └── dashboards/
│           └── presto-dashboard.json       # 24-panel production dashboard definition
├── scripts/
│   └── flood_queue.sh                      # Workload generator to simulate resource group contention
└── spill/
    ├── worker-1/                           # Host-mounted spill directory for worker 1
    └── worker-2/                           # Host-mounted spill directory for worker 2
Deep-Dive Configuration Breakdown
Presto JVM & JMX Exporter (jvm.config & presto-jmx-exporter.yaml)
Coordinator JVM Hook (config/presto-coordinator/etc/jvm.config)
We attach the JMX Prometheus Java agent directly into the Presto JVM startup parameters:
-server
-Xmx1G
-XX:+UseG1GC
-XX:+ExplicitGCInvokesConcurrent
-XX:+HeapDumpOnOutOfMemoryError
-XX:+ExitOnOutOfMemoryError
-Djdk.attach.allowAttachSelf=true
--add-opens=java.base/java.io=ALL-UNNAMED
--add-opens=java.base/java.lang=ALL-UNNAMED
...
-javaagent:/opt/jmx_prometheus_javaagent.jar=0.0.0.0:8081:/opt/presto-jmx-exporter.yaml
-server -Xmx1G: Sets 1GB heap allocation for sandbox stability.-XX:+UseG1GC: Enables the Garbage-First Collector, ideal for high-concurrency low-pause SQL engines.-javaagent:...=0.0.0.0:8081:...: Starts an embedded HTTP listener on port8081to serve Prometheus metrics.
Regex MBean Translation Engine (config/presto-shared/presto-jmx-exporter.yaml)
This configuration maps complex Presto MBean domain paths into clean, multi-dimensional Prometheus metrics:
lowercaseOutputName: true
includeObjectNames:
  - "com.facebook.presto.execution.resourceGroups:*"
  - "com.facebook.presto.execution:name=QueryManager"
  - "com.facebook.presto.execution:name=TaskManager"
  - "com.facebook.presto.execution.executor:name=TaskExecutor"
  - "com.facebook.presto.memory:name=ClusterMemoryManager"
  - "com.facebook.presto.spiller:name=SpillerStats"
  - "com.facebook.presto.metadata:name=MetadataManagerStats"
  - "com.facebook.presto.server:name=ExchangeExecutionMBean"
  - "com.facebook.presto.hive.metastore:*"
  - "com.facebook.airlift.http.client:*"

rules:
  # 1. Leaf Resource Groups (global.TEAM.USER) -> Extract team and user labels
  - pattern: '(?i).*global\.([^.,<>]+)\.([^.,<>]+)[^<>]*><>(runningqueries|maxqueuedqueries|queuedqueries)'
    name: presto_user_resourcegroup_$3
    labels:
      team: "$1"
      user: "$2"

  # 2. Team-level Parent Resource Groups
  - pattern: '(?i).*global\.([^.,<>]+)[^<>]*><>(runningqueries|maxqueuedqueries|queuedqueries)'
    name: presto_user_resourcegroup_$2
    labels:
      team: "$1"
      user: "all"

  # 3. Global Root Group
  - pattern: '(?i).*name=(global)[^<>]*><>(runningqueries|maxqueuedqueries|queuedqueries)'
    name: presto_user_resourcegroup_$2
    labels:
      team: "global"
      user: "global"

  # 4. QueryManager Gauges
  - pattern: '(?i).*name=querymanager.*(runningqueries|queuedqueries)'
    name: presto_querymanager_$1

  # 5. Query Lifetime Cumulative Counters
  - pattern: '(?i).*name=querymanager.*(completedqueries|submittedqueries|startedqueries|failedqueries|abandonedqueries|canceledqueries|consumedcputimesecs|usererrorfailures|internalfailures|externalfailures|insufficientresourcesfailures)\.totalcount'
    name: presto_querymanager_$1_total

  # 6. Latency Percentiles (p50, p75, p90, p95, p99 in ms)
  - pattern: '(?i).*name=querymanager.*executiontime\.alltime\.(p50|p75|p90|p95|p99)'
    name: presto_querymanager_executiontime_alltime_$1

  # 7. Split Scheduling States (running, waiting, blocked)
  - pattern: '(?i).*name=taskexecutor.*(running|waiting|blocked)splits'
    name: presto_executor_taskexecutor_splits
    labels:
      state: "$1"
Presto Coordinator vs. Worker Engine Configuration (config.properties)
Coordinator Configurations (config/presto-coordinator/etc/config.properties)
node.id=presto-coordinator
coordinator=true
node-scheduler.include-coordinator=false
http-server.http.port=8080
discovery-server.enabled=true
discovery.uri=http://localhost:8080
query.max-memory-per-node=30MB
query.max-total-memory-per-node=150MB
Worker Configurations & Disk Spilling (config/presto-worker-1/etc/config.properties)
node.id=presto-worker-1
coordinator=false
http-server.http.port=8080
discovery.uri=http://presto-coordinator:8080
experimental.spill-enabled=true
experimental.spiller-spill-path=/tmp/presto/spill
experimental.max-spill-per-node=10GB
experimental.query-max-spill-per-node=2GB
experimental.aggregation-spill-enabled=true
experimental.join-spill-enabled=true
query.max-memory-per-node=30MB
query.max-total-memory-per-node=150MBexperimental.spill-enabled=true: Prevents Out-Of-Memory (OOM) errors during memory-heavy aggregations and joins by offloading data chunks to host-mounted/tmp/presto/spillvolumes.
Multi-Tenant Resource Groups Hierarchy (resource-groups.json)
Resource groups enforce tenant concurrency boundaries and query queuing:
{
  "rootGroups": [
    {
      "name": "global",
      "softMemoryLimit": "80%",
      "hardConcurrencyLimit": 100,
      "maxQueued": 1000,
      "jmxExport": true,
      "subGroups": [
        {
          "name": "data_engineering",
          "softMemoryLimit": "30%",
          "hardConcurrencyLimit": 10,
          "maxQueued": 100,
          "jmxExport": true,
          "subGroups": [
            { "name": "bob", "softMemoryLimit": "15%", "hardConcurrencyLimit": 4, "maxQueued": 20, "jmxExport": true },
            { "name": "sam", "softMemoryLimit": "10%", "hardConcurrencyLimit": 2, "maxQueued": 10, "jmxExport": true }
          ]
        },
        {
          "name": "data_analysts",
          "softMemoryLimit": "30%",
          "hardConcurrencyLimit": 15,
          "maxQueued": 150,
          "jmxExport": true,
          "subGroups": [
            { "name": "noah", "softMemoryLimit": "15%", "hardConcurrencyLimit": 4, "maxQueued": 20, "jmxExport": true },
            { "name": "patrick", "softMemoryLimit": "10%", "hardConcurrencyLimit": 3, "maxQueued": 15, "jmxExport": true },
            { "name": "clara", "softMemoryLimit": "5%", "hardConcurrencyLimit": 1, "maxQueued": 5, "jmxExport": true }
          ]
        },
        {
          "name": "data_science_ml",
          "softMemoryLimit": "20%",
          "hardConcurrencyLimit": 5,
          "maxQueued": 50,
          "jmxExport": true,
          "subGroups": [
            { "name": "rowlyn", "softMemoryLimit": "15%", "hardConcurrencyLimit": 3, "maxQueued": 15, "jmxExport": true }
          ]
        },
        {
          "name": "default",
          "softMemoryLimit": "10%",
          "hardConcurrencyLimit": 5,
          "maxQueued": 50,
          "jmxExport": true
        }
      ]
    }
  ],
  "selectors": [
    { "user": "bob", "group": "global.data_engineering.bob" },
    { "user": "sam", "group": "global.data_engineering.sam" },
    { "user": "noah", "group": "global.data_analysts.noah" },
    { "user": "patrick", "group": "global.data_analysts.patrick" },
    { "user": "clara", "group": "global.data_analysts.clara" },
    { "user": "rowlyn", "group": "global.data_science_ml.rowlyn" },
    { "user": ".*", "group": "global.default" }
  ],
  "cpuQuotaPeriod": "1h"
}
Important: The setting
"jmxExport": trueis required on each resource group node. Without it, Presto will not expose the MBean metrics needed for Grafana’s multi-tenant queue dashboards.
Prometheus Scraping Configuration (config/prometheus/prometheus.yml)
global:
  scrape_interval: 5s
  evaluation_interval: 5s

rule_files:
  - "alert.rules.yml"

alerting:
  alertmanagers:
    - static_configs:
        - targets:
            - 'alertmanager:9093'

scrape_configs:
  - job_name: 'presto'
    scrape_interval: 10s
    scrape_timeout: 9s
    static_configs:
      - targets: ['presto-coordinator:8081']
        labels:
          role: 'coordinator'
      - targets: ['presto-worker-1:8081', 'presto-worker-2:8081']
        labels:
          role: 'worker'
Production Alerting Framework (config/prometheus/alert.rules.yml)
The alert rules are organized into a 3-tier severity structure (P1 Critical, P2 High, P3 Warning):
groups:
  - name: presto_alerts
    rules:
      # 🔴 P1 — Critical (Cluster Outage / Immediate Action Required)
      - alert: PrestoWorkerDown
        expr: up{role="worker"} == 0
        for: 1m
        labels: { severity: critical }
        annotations:
          summary: "Presto Worker Down"
          description: "A worker node (instance {{ $labels.instance }}) is offline. Active queries will fail and capacity drops."

      - alert: PrestoCoordinatorDown
        expr: up{role="coordinator"} == 0
        for: 1m
        labels: { severity: critical }
        annotations:
          summary: "Presto Coordinator Down"
          description: "The coordinator node is offline. Cluster query submissions will fail entirely."

      - alert: PrestoHeapMemoryCritical
        expr: jvm_memory_bytes_used{area="heap"} / jvm_memory_bytes_max{area="heap"} > 0.90
        for: 2m
        labels: { severity: critical }
        annotations:
          summary: "Presto Heap Memory Critical"
          description: "JVM heap on {{ $labels.instance }} is over 90% full (currently {{ printf \"%.2f\" $value }}). Imminent risk of OutOfMemoryError."

      # 🟠 P2 — High (Performance Degradation / Action Required Soon)
      - alert: PrestoInternalFailuresSpike
        expr: rate(presto_querymanager_internalfailures_total[5m]) > 0
        labels: { severity: high }
        annotations:
          summary: "Presto Internal Failures Spike"
          description: "Internal system failures occurring (rate: {{ printf \"%.4f\" $value }}/s). Indicates system bugs or infrastructure issues."

      - alert: PrestoDiskSpillSpike
        expr: rate(presto_spill_spilledbytes_total[5m]) > 5242880
        for: 2m
        labels: { severity: high }
        annotations:
          summary: "Presto Disk Spill Spike"
          description: "Heavy disk spilling detected on instance {{ $labels.instance }} (> 5MB/s). Query latency will degrade significantly."

      - alert: PrestoQueueBacklog
        expr: sum(presto_user_resourcegroup_queuedqueries{user!~"all|global"}) > 20
        for: 5m
        labels: { severity: high }
        annotations:
          summary: "Presto Queue Backlog"
          description: "Over 20 queries are queued across resource groups (currently {{ $value }}). Check resource group concurrency caps."

      - alert: PrestoHighGCOverhead
        expr: rate(jvm_gc_collection_seconds_sum{role="coordinator"}[2m]) > 0.2
        labels: { severity: high }
        annotations:
          summary: "Presto High GC Overhead"
          description: "Coordinator GC pauses consume > 20% of CPU time. Risks heartbeat drops and node flapping."

      # 🟡 P3 — Warning (Proactive Anomaly Detection)
      - alert: PrestoQueriesRejectedQueueFull
        expr: rate(presto_querymanager_insufficientresourcesfailures_total{job="presto"}[5m]) > 0
        labels: { severity: warning }
        annotations:
          summary: "Presto Queries Rejected (Queue Full)"
          description: "Queries rejected because a resource group exceeded max queued capacity."

      - alert: PrestoHighQueryFailureRate
        expr: (rate(presto_querymanager_internalfailures_total[5m]) / rate(presto_querymanager_submittedqueries_total[5m]) > 0.05) and (rate(presto_querymanager_submittedqueries_total[5m]) > 0.05)
        labels: { severity: warning }
        annotations:
          summary: "Presto High Query Failure Rate"
          description: "More than 5% of submitted queries are failing due to internal system errors."

      - alert: PrestoHighP95Latency
        expr: presto_querymanager_executiontime_alltime_p95 > 60000
        for: 5m
        labels: { severity: warning }
        annotations:
          summary: "Presto High P95 Latency"
          description: "P95 query execution time exceeds 60s (currently {{ printf \"%.2f\" $value }} ms)."
Incident Routing & Slack Notifications (config/alertmanager/alertmanager.yml)
route:
  group_by: ['alertname']
  group_wait: 5s
  group_interval: 10s
  repeat_interval: 1h
  receiver: 'slack-receiver'

receivers:
- name: 'slack-receiver'
  slack_configs:
  - api_url: 'https://hooks.slack.com/services/YOUR_WEBHOOK_HERE'
    channel: '#incident-alert'
    send_resolved: true
    title: '{{ if eq .Status "firing" }}🔥 [FIRING:{{ .Alerts.Firing | len }}]{{ else }}✅ [RESOLVED]{{ end }} {{ .CommonLabels.alertname }}'
    title_link: 'http://localhost:3000/alerting/list'
    color: '{{ if eq .Status "firing" }}{{ if eq .CommonLabels.severity "critical" }}#d63031{{ else if eq .CommonLabels.severity "high" }}#e17055{{ else }}#fdcb6e{{ end }}{{ else }}#2ecc71{{ end }}'
    text: >-
      {{ range .Alerts }}
      *Severity:* `{{ .Labels.severity | toUpper }}` | *Instance:* `{{ .Labels.instance }}`
      *Summary:* _{{ .Annotations.summary }}_
      *Description:* {{ .Annotations.description }}

      {{ end }}
Automated Grafana Dashboard Provisioning
Grafana auto-loads the Prometheus data source and pre-built dashboard on startup:
config/grafana/provisioning/datasources/prometheus.yaml➡️ Connects Grafana to Prometheus.config/grafana/provisioning/dashboards/presto.yaml➡️ Importspresto-dashboard.json.
Step-by-Step Hands-On Guide: Launching and Verifying the Stack
Step 1: Start All Services
git clone https://github.com/saurabhmahawar/presto_observability_pipeline.git
cd presto_observability_pipeline
docker-compose up -d
Step 2: Verify Running Containers
docker psEnsure all 6 containers (presto-coordinator, presto-worker-1, presto-worker-2, prometheus-server, grafana-dashboard, alertmanager-server) are active.
Step 3: Open Web Dashboards
- Grafana: http://localhost:3000 (Login:
admin/admin) - Prometheus Targets: http://localhost:9090/targets (Confirm 3 targets
UP) - Alertmanager UI: http://localhost:9093
- Presto Coordinator UI: http://localhost:8080
The 24-Panel Grafana Dashboard Guided Tour
The dashboard delivers real-time visibility across three structured rows:
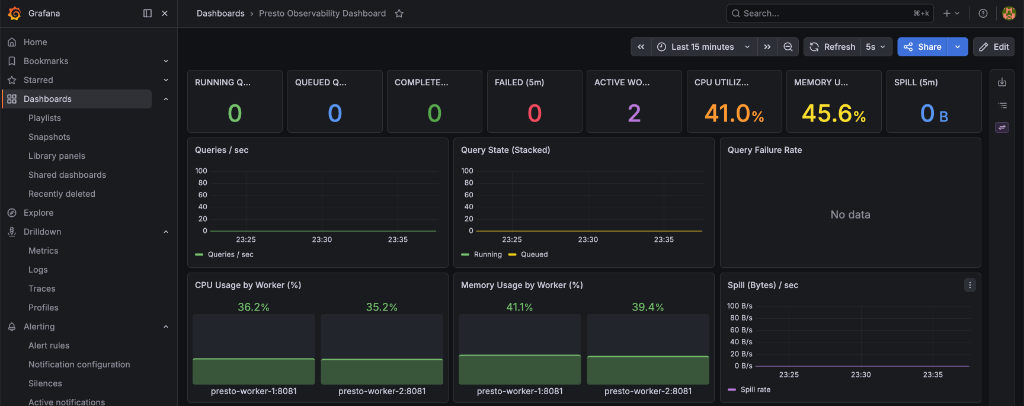
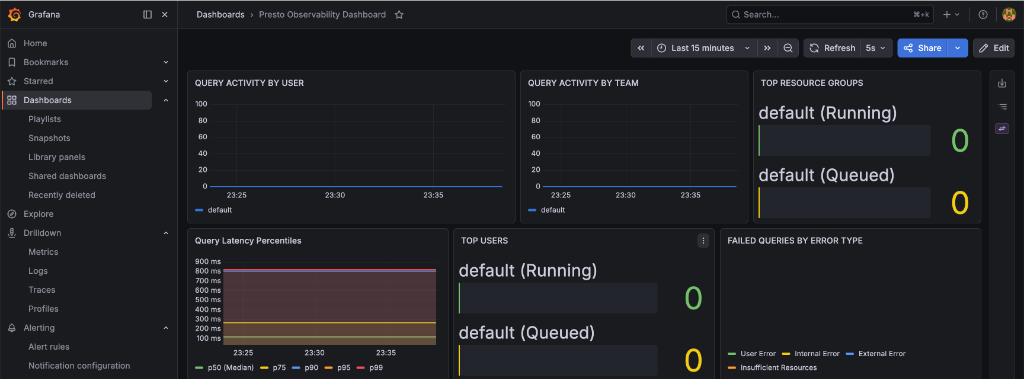
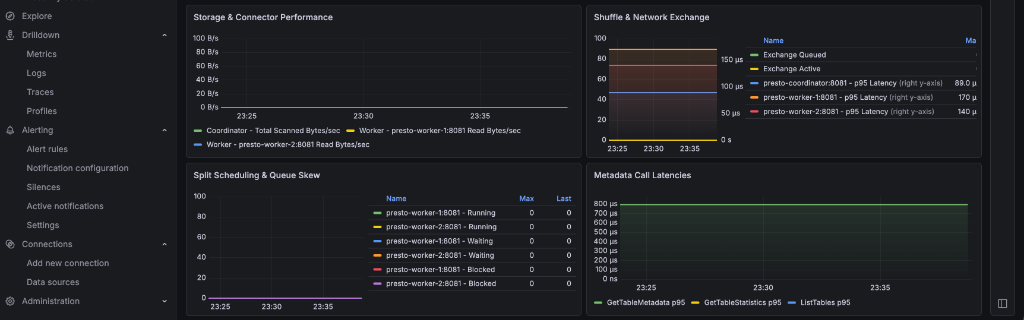
Key Metrics Overview
- Panels 1–14: Top-level cluster health, node counts, CPU/Memory utilization, and disk spill write rates.
- Panels 15–20: Multi-tenant metrics by user and team, top resource group contention, P50-P99 latencies, and error categorization (
USER_ERROR,INTERNAL_ERROR,INSUFFICIENT_RESOURCES). - Panels 21–24: Storage connector scan rates, inter-worker HTTP shuffle thread stats, split states (
Running,Waiting,Blocked), and Metastore API call latencies.
Hands-On Operational Simulation
Multi-Tenant Resource Group Queue Backlog Simulation
Objective
Demonstrate multi-tenant query queuing and observe how Prometheus and Grafana track concurrent resource group saturation.
Execution
Run the workload generator script:
./scripts/flood_queue.shWorkload Dynamics:
The script submits 31 concurrent queries:
- Bob (Data Engineering, Limit = 4): 11 submitted ➡️ 4 Running + 7 Queued
- Sam (Data Engineering, Limit = 2): 9 submitted ➡️ 2 Running + 7 Queued
- Noah (Data Analysts, Limit = 4): 11 submitted ➡️ 4 Running + 7 Queued
- Total Cluster Load: 10 Running + 21 Queued
Live Observation
1. In Grafana (http://localhost:3000):
- Watch RUNNING QUERIES reach
10and QUEUED QUERIES spike to21. - Check QUERY ACTIVITY BY USER and QUERY ACTIVITY BY TEAM to isolate queue depths per tenant.
2. In Prometheus (http://localhost:9090):
sum(presto_user_resourcegroup_queuedqueries{user!~"all|global"})3. In Presto CLI:
docker exec -it presto-coordinator presto-cli --user workshop_observerQuery runtime query states:
 SELECT "user", state, COUNT(*) AS query_count
   FROM system.runtime.queries
   WHERE "user" IN ('bob', 'sam', 'noah')
   GROUP BY "user", state
   ORDER BY "user", state;
Chaos Engineering — Worker Failure, Recovery & Slack Alerts
Objective
Test node failover, alert firing lifecycle, and automated Slack resolution notifications.
1. Stop Worker 1:
docker stop presto-worker-12. Observe Alert Firing:
- Open Prometheus at
http://localhost:9090/alerts. - Notice
PrestoWorkerDowntransition fromPENDING➡️FIRINGafter 1 minute. - Grafana ACTIVE WORKERS panel drops from
2to1. - Alertmanager posts a red incident notification to Slack.
3. Recover Worker 1:
docker start presto-worker-1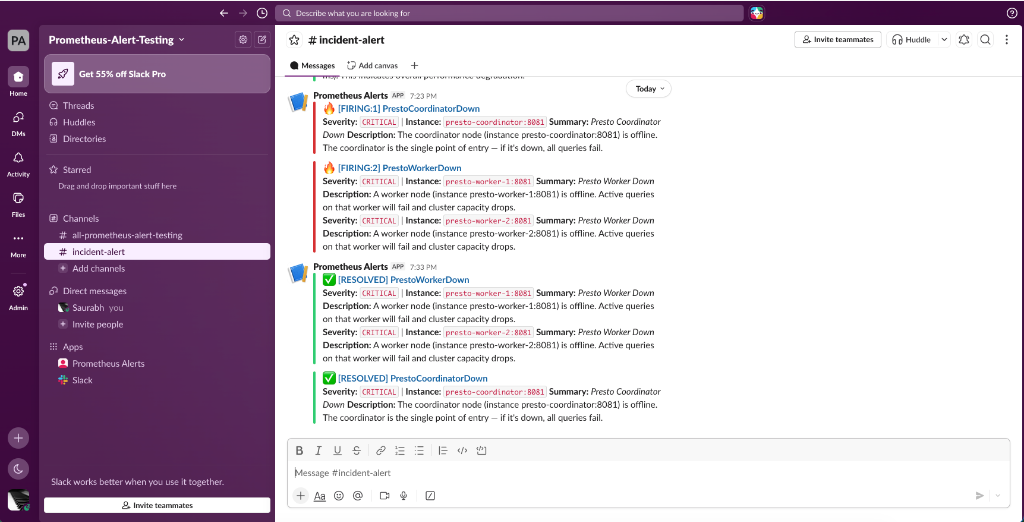
- Prometheus marks the alert inactive.
- Alertmanager automatically sends a green
✅ [RESOLVED]notification to Slack.
Querying Prometheus Metrics via Presto SQL
Objective
Execute ANSI SQL queries against Prometheus time-series data using Presto’s built-in Prometheus Connector.
Connect to Presto CLI:
docker exec -it presto-coordinator presto-cli1. Show available metric tables:
SHOW TABLES FROM prometheus.default;2. Inspect metric schema:
DESCRIBE prometheus.default.up;3. Query time-series with time predicate:
SELECT instance, role, value, timestamp FROM prometheus.default.up WHERE timestamp > NOW() - INTERVAL '5' MINUTE ORDER BY timestamp DESC LIMIT 10;4. Join Presto internal JMX tables with Prometheus metrics:
SELECT
    p.instance,
    p.role,
    p.value AS is_up,
    j.runningqueries
FROM prometheus.default.up p
JOIN jmx.current."com.facebook.presto.execution:name=querymanager" j ON 1=1
WHERE p.timestamp > NOW() - INTERVAL '5' MINUTE
LIMIT 5;
Metric Discovery & Custom JMX Telemetry Extraction
Objective
Discover a new MBean inside the Presto JVM using SQL, translate it to Prometheus format, and display it.
1. Discover MBeans using Presto SQL:
SHOW TABLES FROM jmx.current LIKE '%memory%';
DESCRIBE jmx.current."com.facebook.presto.memory:name=clustermemorymanager";
2. Add Regex Translation to config/presto-shared/presto-jmx-exporter.yaml:
- pattern: '(?i).*name=clustermemorymanager.*(assignedqueries)'
  name: presto_clustermemorymanager_$1
3. Apply Configuration:
docker-compose restart presto-coordinator4. Query in Prometheus: Query presto_clustermemorymanager_assignedqueries in http://localhost:9090.
Summary & Next Steps
You now have a fully operational, enterprise-grade observability and alerting pipeline for Presto. To explore further:
- Customize your alerting rules in
alert.rules.yml - Adjust tenant limits in
resource-groups.json - Set up your production Slack Webhook in
alertmanager.yml
Official Links & Video Workshop
To follow along with video demonstrations, explore source code, and join the Presto community:
- GitHub Repository: https://github.com/saurabhmahawar/presto_observability_pipeline
- Hands-On Video Workshop (YouTube): Monitor Presto at Petabyte Scale
- Presto Official Documentation: https://prestodb.io/docs/current/
- Presto JMX Connector Reference: Presto JMX Docs